Plant Security During Operational Turnarounds
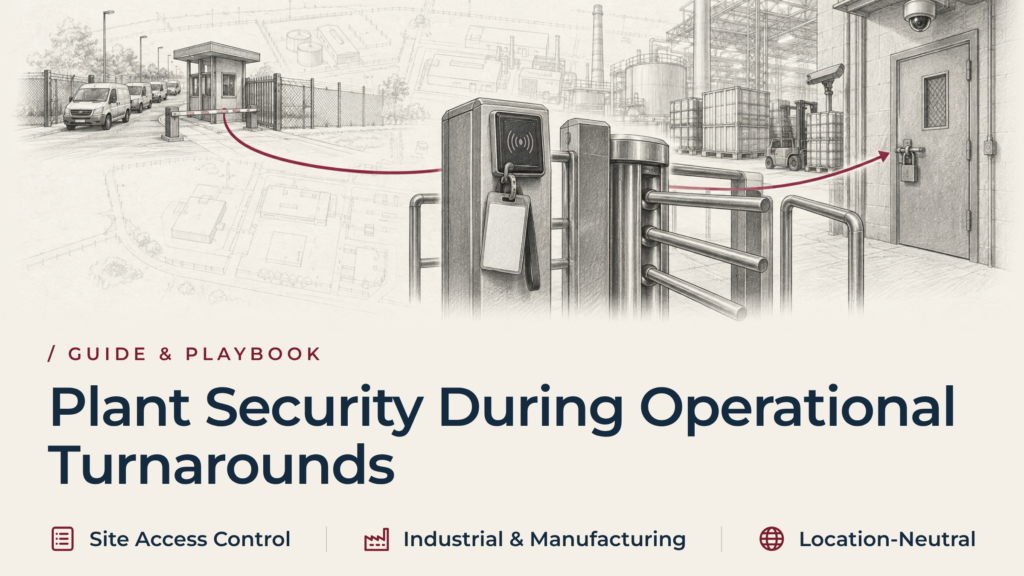
Learn how plant leaders can strengthen security during operational turnarounds by controlling contractor access, restricted areas, credentials and site risks.
Four in ten surveyed investors would no longer choose Slovakia

Only 4 per cent of surveyed companies rate the Slovak economic situation as good, and
four in ten investors would no longer choose the country. For an owner with a plant there, that is a trigger to retest the case, not a
verdict on the plant.
Serbian Ramp-Up Stalling: Three Board Decisions That Should Have Happened Earlier

A German conglomerate operates plants in Poland and Serbia under one COO. Poland is shipping to plan. Serbia is ramping new capacity. The Group Board receives monthly KPIs: aggregate output is tracking, capital spend is within budget, and the portfolio appears sound. What the board does not see is that Tier 2 ramp-up board visibility manufacturing metrics at the Serbian operation are deteriorating in ways aggregate reporting masks. Labour scarcity is compressing timelines. Customer delivery milestones are sliding. By the time the formal escalation reaches the board, the cost of delay has crystallised. The Core Problem This is not incompetence. It is a story about how Tier 2 operational oversight fails when portfolio governance depends on aggregate metrics and board attention concentrates on sites that deliver to plan. Market Context Serbia’s automotive industry generated €4 billion in exports in 2025, representing 12.3 per cent of total exports. According to the UNDP labour market study, labour demand in Serbia will increase from 125,000 in 2024 to 144,000 in 2026, with manufacturing leading. The impact manifested acutely in 2025: 1. 12,640 workers in Serbia’s automotive sector were placed on paid leave at 60 per cent compensation longer than legally allowed. 2. This resulted in dismissal of more than 6,000 employees. 3. The effect cascaded into ramp-up delays DACH headquarters never detected until customer delivery penalties arrived. Decision 1: How Many Sites Can A COO Oversee Without Losing Visibility? The Structural Accountability Gap A COO overseeing multiple sites typically manages through quarterly reviews and exception reporting. This works when sites are mature and performing to plan. It fractures when a COO manages both a delivering site (Poland) and a ramp-up site (Serbia) simultaneously. The delivering site demands optimisation attention. The ramp-up site demands escalation and problem-solving. One person cannot give both sufficient scrutiny. What Actually Happened Month 8 of the ramp-up: Serbian operation missed labour recruitment targets. The Plant Manager flagged it to the COO. The COO understood the risk but did not escalate to the board because aggregate portfolio numbers still looked acceptable, driven by Poland’s solid delivery. The decision not to escalate was rational under the assumption that a Tier 2 variance could be resolved locally. That assumption was wrong. Why Board Attention Disappears The Serbian automotive sector saw revenues rise from €7.2 billion in 2023 to €8.3 billion in 2024, but forecasters warned in January 2026 that 2025 could be significantly weaker due to falling EU demand according to CorD Magazine. That external pressure was already known. What was unknown was that labour scarcity would compress the window for recovery. Decision 2: At What Variance Threshold Triggers Board Review? The Aggregate Metrics Trap Most boards receive portfolio-level KPIs, not site-by-site detail. The Missing Decision Rule Few boards have explicitly defined the variance threshold at which a secondary market ramp-up requires board-level intervention. In practice, what constitutes an anomaly is subjective. Decision 3: Who Escalates Before The Customer Does? The Skill Displacement Problem The Stellantis EV conversion at Kragujevac illustrates the problem. The conversion compressed demand for traditional machinists by 12 per cent year-over-year while increasing demand for battery technicians by 34 per cent. A Plant Manager facing this transition cannot solve it locally. Specialised skills do not exist in sufficient supply. This requires board-level capital reallocation. Options available to the board: 1. Upskill (expensive and slow). 2. Outsource non-core assembly (margin hit). 3. Extend the ramp timeline (delays cash return). 4. The Plant Manager cannot make this decision. The COO may not escalate it without board authority. When Customer Escalation Becomes Liability OEM customers operate on fixed delivery schedules. A slip of two to four weeks is normal variance. A slip of eight to twelve weeks triggers formal escalation and penalty review. The escalation sequence in the Serbian case: 1. Month 8: Plant Manager should have escalated to the COO when labour targets were missed. 2. Month 10: COO should have escalated to the board, framed as customer delivery risk. 3. Month 12: Customer saw the miss through delayed shipments. 4. Month 13: Customer placed formal claim. That is how Tier 2 operational oversight failures become customer escalation risk and cash liability. Why Aggregate KPIs Miss Operational Reality A board typically tracks portfolio output, capital spend, margin, and cash flow. This variance may fall within tolerance if market headwinds were already factored. What the aggregate does not show is the composition: Poland over-delivering to compensate for Serbia’s structural problem. Poland cannot sustain that for 18 months. When Poland returns to normal run-rate in Month 16, the portfolio collapses. The Intervention Question When Board Escalation Finally Comes In Month 13, the customer formalises a delivery penalty claim. The board faces three options. 1. Invest capital and temporary executive resources to rescue the operation. This requires €15 to €20 million and assumes the labour market and customer patience both hold. 2. Extend the ramp by six months. This delays cash return but reduces monthly wage pressure. 3. Sell or close the operation and consolidate Serbian supply into Poland or Romania. The board faces a restructuring decision it should have made at Month 10, when variance was internal. The board’s options have narrowed. At Month 13, when the customer has already escalated, any injected leader has less leverage and must work within tighter constraints. Structural Prevention Governance Architecture Without Single-Point Failure The structural problem is not that one COO oversees multiple sites. It is that accountability for ramp-up variance is distributed across multiple roles without clear escalation ownership. A more robust structure assigns explicit accountability in this sequence: 1. Plant Manager owns site-level performance and is required to escalate to the COO if any leading indicator breaches a defined threshold. 2. COO owns multi-site portfolio performance and must escalate to the Board if a threshold is breached. 3. Board owns portfolio-level variance review and must decide on capital reallocation or scope adjustment within a defined timeframe. Separating Ramp-Up Oversight From Aggregate Reporting Most boards receive portfolio-level KPIs quarterly. This is appropriate for
One version of the truth: restoring visibility between a Romanian plant and Swiss headquarters

In brief When a Swiss parent and its Romanian plant work from different numbers, the issue is rarely dishonesty. Headquarters reads aggregated monthly ERP (enterprise resource planning) output. The plant runs the day on local schedules, informal rework decisions and unrecorded work in progress. Until both work from one verified fact base, the Board cannot price its own risk. Restoring control means establishing the physical facts on site and defining who may decide what. It means appointing an executive with both financial and operational authority. The trigger: operational reporting and cash flow position stop agreeing The situation reaches the Board in a recognisable form. The Romanian subsidiary reports stable output, acceptable delivery and controlled cost. The consolidated cash position says something else. Working capital rises and the plant requests funding again. Nobody at group level can explain the difference from the pack. The instinct is to ask for more reporting, and it is reasonable. More detail is the lever headquarters can pull. But reporting drawn from the same data does not make that data more reliable. Boards move slowly for a second reason. Establishing the real position has consequences, from writing down inventory to restating a signed-off margin. A Group CEO or family owner weighing that step is carrying a real cost, not avoiding an uncomfortable conversation. The calendar sets the timetable, not the discomfort: the year-end count and audit, the next covenant test, the next funding tranche. If due diligence or the year-end auditor discovers the position first, someone else prices it. Both the count and the write-down are easier when the owner picks the date. Why cross-border reporting gaps widen between plants and headquarters Four conditions widen it, each with a legitimate origin. Where group ERP routings do not reflect real setup times, local planners build spreadsheets to run the day. Two records exist, but they rely on only one to decide. When write-off approval sits at group level, the plant sets rejected parts aside for rework that never happens. They stay on the books as work in progress: a process design gap, not local evasion. When the plant measures on-time delivery against its own revised date, both sides measure honestly, yet they measure different things. The International Journal of Quality & Service Sciences identifies this as a recurring pattern in unverified front-line reporting. Distance removes the informal correction a domestic controller applies by walking the floor. Across a border, a video call explains variances, often correctly, but nobody tests them against a bin. This is not a subsidiary concealing its position from an owner. It is two organisations, each behaving reasonably and holding different halves of the same picture. Nothing connects machine-level output to financial performance. Multiple research reports treat that connection as the precondition for managing operational and financial performance. Specific financial reporting challenges in Swiss-Romanian manufacturing Three features make this version harder to close. The Romanian entity keeps statutory accounts under local fiscal rules, alongside the group pack. Two legitimate sets of books exist. Local attention sits with the one a tax authority backs. A Swiss group applies a materiality threshold, but the local finance team may never have heard about it. Balances the plant treats as housekeeping are exactly those that matter at consolidation. Swiss franc (CHF) and Romanian leu (RON) translation absorbs part of the drift in conversion cost before it reaches the consolidated margin. That is one reason unit cost and cash movement can both look defensible. The group can test two of these from Switzerland. One is reconciling statutory inventory valuation against the group pack by category. The other is restating unit conversion cost in RON at constant rates. Materiality needs a conversation with the local controller, not a file. How the Board identifies disconnects in plant performance reporting Headquarters can observe these conditions without an investigation. Where any three of these five persist across two monthly closes, headquarters is responding to a period that has already closed. Steps to establishing one verified fact base across manufacturing sites Starting with the reporting system is the wrong first move. A system built on unverified balances reproduces the same error, faster. The sequence starts with a physical count of raw material, work in progress, finished goods and uncounted rework racks. The team reconciles the count to the general ledger and brings a write-off proposal to the Board within three to four weeks. Restate the last six months of deliveries against customers’ original requested dates. The balance sheet is only half of what the Board is pricing. Presume variance is a design fault until evidence says otherwise. Variance traceable to an unrecorded process is structural. Variance that changes as the team examines it, or that someone amends after a count date, signals irregularity instead. The response then changes: preserve evidence and access, involve advisers, and then speakto the plant. The mandate sponsor, typically the Group CEO or the accountable Board member, makes that switch on evidence, not the executive alone. While the count runs, the plant keeps shipping. The team runs a controlled count by area, not a full stop. It moves funding onto a rolling forecast instead of releasing it against requests. Once the team establishes the position, two definitions matter more than any ERP project. The workstation logs scrap the moment it occurs, not the system at month end. On-time delivery counts against the customer’s original date. Decision rights follow the same logic. The plant records scrap disposal below an agreed value locally the same day. It refers anything above that to the group within a defined response time. Headquarters commits to brief local staff on materiality and respond to escalations within a set time. ERP harmonisation and the permanent finance appointment can wait until this holds. The two non-delegable Board decisions for operational control The trade-off is narrower than it appears. It is not accuracy versus speed. The real choice is whether to accept a visible write-down now, building a fact base every later decision can rely on. The alternative
When DACH Headquarters Must Manage Turnarounds in Poland, Czech Republic and Romania Simultaneously

A German automotive supplier holds controlling stakes across Poland, Romania, and Czech Republic. Polish output is strong but wage pressure is rising. Romanian manufacturing contracted 5 percent since 2021. Czech capacity is stable but labour is tightening. A multi-country portfolio turnaround CEE is under discussion at board level. What the board does not yet grasp is that three individually sound recovery plans, executed simultaneously, will collide at the governance level and destroy value even if each site improves operationally. The CEO’s Dilemma: Consolidated Narrative Versus Operational Reality A Chief Executive Officer running a multi-country portfolio faces a fundamental problem. The CEO holds ultimate accountability for consolidated financial performance, return on invested capital, and strategic coherence. These metrics demand a single narrative: the portfolio is underperforming for X reasons, recovery requires Y interventions, and consolidated EBITDA will improve by 15 percent. Operating reality tells three separate stories According to XYZ analysis from July 2026, Polish industrial production in June 2026 was nearly 16 percent higher than in 2021, the strongest performance in the region. The Polish operation manages demand successfully while absorbing wage inflation. The recovery story in Poland is about margin protection, not operational rescue. Romania presents a different operating problem. According to Institutul Național de Statistică, Romanian industrial output has contracted by approximately 5 percent since 2021. Manufacturing specifically declined 6.0 percent year-on-year in January 2026. This is the visible consequence of structural demand loss. The automotive industry accounts for approximately 10 percent of GDP and nearly 50 percent of total exports. Romania’s turnaround requires capital deployment and a multi-year recovery timeline with uncertain cash generation in the near term. The Czech Republic operation produces stable financial results. Yet behind those results, tight labour availability is creating deferred maintenance and hidden capacity constraints. A consolidated recovery narrative that treats all three sites as components of a single turnaround plan obscures these incompatible realities. The COO’s Bandwidth Problem: One Executive Cannot Hold Three-Country Authority The operational plan for a multi-country portfolio turnaround CEE typically assigns responsibility to a single Chief Operating Officer, who is expected to hold line authority over all three countries, ensure reporting consistency, and drive decision velocity. This is a design flaw that appears rational in an organisation chart but fails in execution. Labour shortage creates country-specific constraints In Poland, according to the Voivodeship Labour Office in Kraków’s Occupational Barometer 2026, shortage occupations include electricians, electromechanics, electrical fitters, welders, and CNC machine operators. A COO responsible for Poland must spend disproportionate time on labour retention, wage negotiation, and tactical headcount decisions. The same executive cannot simultaneously hold the same quality of attention on Romania, where the problem is demand stabilisation and cash preservation, or on the Czech Republic, where the problem is capacity planning under labour tightness. Decision velocity collapses across three countries Multi-plant restructuring creates competing demands: The CFO’s Capital Deployment Choice: When Investment Becomes a Hierarchy A CFO managing capital allocation across a multi-country portfolio turnaround CEE must answer: which country gets investment capital, which gets restructuring capital, which gets managed for cash? If Poland requires €15 million to protect margin, Romania requires €25 million to stabilise operations, and Czech Republic requires €10 million to address deferred maintenance, the total requirement is €50 million. Most mature industrial groups do not have €50 million available when capital competes with dividends, strategic investments, and debt service. The CFO faces a hierarchy of incompatible choices Each choice has different outcomes for consolidated EBITDA and portfolio resilience. Yet no choice is presented as such to the board. Instead, the CFO constructs a narrative of “efficiency” or “phased investment” that conceals an operating hierarchy where one country is being prioritised over others. The PE Partner’s Thesis Challenge: Portfolio Targets Collide with Recovery If the portfolio is backed by private equity, a PE partner has a simple mandate: improve consolidated portfolio EBITDA by a target percentage within 18 to 36 months. This is the core investment thesis. When a multi-country portfolio turnaround CEE is proposed, the PE partner is agreeing to improve EBITDA across three countries through operational intervention. The reality is far more complex. All three countries face the same structural headwind According to the European Trade Union Confederation data from March 2024, the EU lost approximately 1 million manufacturing jobs between 2019 and 2023. Poland recorded 278,000 job losses, Romania recorded 144,000, and Germany recorded 129,000. These losses reflect structural changes in industrial capacity and labour economics, not temporary market weakness. Resolving Competing Authority: Regional Executive Accountability Becomes Necessary The governance failure across these competing roles is not solved by adding process or improving reporting templates. It is solved by establishing clear, singular executive authority for the portfolio as a whole, separate from daily management of individual country operations. What a regional executive authority must hold This is not a coordinating role. It is an executive authority role. A coordinator transmits decisions; an executive authority makes them. How this authority should be governed determines whether the role succeeds or becomes a bottleneck that slows portfolio recovery. This role cannot be permanent When manufacturing employment is contracting across the region and individual sites are pulling in different directions, the regional executive cannot be a permanent addition to the cost base. The role exists to establish facts, sequence decisions, and force alignment. Once that work is done, the role typically migrates away or consolidates with permanent country leadership. The Board’s Decision: Three Distinct Operational Paths The board must now choose what a multi-country portfolio turnaround CEE actually means. This is not a binary decision. It is a sequence of choices across different timeframes. DACH market context: portfolios are being refocused According to ARC Group’s February 2026 analysis, DACH industrial M&A activity has pivoted toward carve-outs, minority stakes, and restructurings. German industrial deal volume reached 551 transactions in 2025. Total deal value moderated to EUR 16.5 billion, a 40 percent decline from the previous year. This shift reflects deliberate portfolio choices: selling non-core assets and concentrating capital on businesses where recovery
When a Slovak Plant Becomes the Least-Watched Site in a DACH-Owned Portfolio

A concrete scenario. A plant with 2,800 employees producing €90 million in annual revenue sits quietly inside a Tier 2 governance Slovakia manufacturing structure. The site reports through a regional cluster manager to headquarters in Stuttgart or Vienna. Quarterly board meetings review the cluster aggregate: headcount, output, cost, quality. The Slovak plant’s profit and loss statement is stable. On-time delivery runs at 96%. EBITDA hits forecast. The plant manager submits his monthly report on schedule. Nobody at the Board level has visited in eighteen months. Then, in month 13 of this stability, a customer escalation arrives. A quality issue has been accumulating for 90 days. An engineer left unexpectedly and was never replaced. A machine that should have been serviced is operating out of specification. The Board’s first question is not why the plant failed. It is why this problem was not seen coming. The answer lies in how Tier 2 governance Slovakia manufacturing actually works across DACH-headquartered industrial portfolios. It is not negligence. It is architecture. The governance model that protects flagship sites, where plant size justifies active board oversight, does not extend effectively to medium-sized secondary operations. The result is a blind spot: a plant performing adequately on quarterly metrics becomes invisible to the decision-makers who control capital, headcount, and escalation authority. The Governance Model Was Built for Flagship Sites, Not Medium Operations When DACH headquarters CEE plant oversight systems were designed, they reflected the realities of the 1990s and early 2000s: centralised manufacturing in major Tier 1 markets. A German automotive supplier headquartered in Stuttgart owned plants in Poland with 5,000 workers, in Czechia with 4,200 workers, and secondary sites elsewhere. The Board established a governance framework around the large sites. A dedicated Tier 1 plant manager reported directly to the regional director. Capital investment decisions were controlled at the plant level. Monthly operational reviews included the plant’s sales team, engineering lead, and plant director. Governance was active and granular. That architecture worked for 5,000-person facilities producing 40 percent of group output. What has changed. As portfolios expanded through acquisition and greenfield investment, the model was stretched. Companies acquired secondary facilities with 2,500 to 3,500 employees. They built regional clustering to simplify reporting. Instead, they created invisibility. The governance framework that worked for five large plants does not scale to twenty plants across seven countries without fundamental redesign. Middle-sized operations producing €80 million to €150 million in annual revenue now exist in a governance gap. Why Medium Plants Disappear: The Governance Threshold Effect The inflection point arrives when a plant becomes too small to warrant individual board attention yet too large to be managed at arm’s length. 1000-person plant: managed as a cost centre | 5000-person plant: requires active board oversight | 3000-person plant: falls in the gap This is where Tier 2 governance Slovakia manufacturing begins to fail. At a 3,000-person facility, the Board does not justify monthly operating reviews. They impose quarterly reporting. The regional cluster manager, who oversees three plants (Hungary with 4,800 workers, Czechia with 3,200, and Slovakia with 2,800), focuses most of his engagement on the largest operation. What happens to the secondary site: The problem is not that the oversight is intentionally light. It is that the governance architecture never defined what adequate oversight means for a medium-sized plant. The default is to apply the model designed for flagship sites, then scale back intensity based on plant size. The result is a plant flying on autopilot. Competitive Pressure Inside Portfolios Pulls Resources Away From Tier 2 Operations Multi-country portfolio management creates internal competition for capital, headcount, and management attention. When headquarter budgets tighten, the largest plants receive protection first. The scale of concentration is real. According to Zväz automobilowego priemyslu Slovenskej republiky, Slovakia produced 1.07 million vehicles in 2025. Volkswagen Bratislava generated 336,905 units; Stellantis Trnava produced 330,000 units; Kia Žilina delivered 296,550 units; Jaguar Land Rover Nitra contributed 107,000 units. The Volkswagen Bratislava facility employs 14,800 workers and produces the VW e-up, Škoda Citigo iV, and Seat Mii Electric. That facility receives governance intensity proportional to its scale and strategic importance. The Stellantis Trnava plant, with 3,300 employees and €3,786 million revenue, receives cluster-level attention. The secondary site absorbs cost-cutting pressure while the flagship carries growth investment. This creates a cascade: The Regional Cluster Trap: How Grouping Three Plants Obscures Individual Risk DACH and French headquarter operate CEE sites through regional governance clusters. A single cluster manager owns profit responsibility for three countries and three plants of different scales. The cluster reports to the board on aggregate performance: workforce utilisation, output, cost per unit, quality metrics. Individually, all three metrics are sound. Collectively, they mask deterioration at the smallest facility. This regional supervision breakdown is structural, not accidental. It emerges from the way cluster reporting is designed. How the trap works: If the Hungarian plant’s performance drifts and threatens cluster profit, the cluster manager focuses there. He cannot afford to lose Hungary. If the Czech plant’s cost structure needs reshaping, capital and attention flow there. The Slovak plant, showing stable performance in all quarterly metrics, becomes the source of free capacity. When the Board asks for €2 million in cost reductions, the Slovak plant absorbs it because the region manager knows it is the only facility he can cut without triggering immediate risk. The plant shrinks. Headcount declines. The plant becomes more efficient on paper. But it has no slack. It is running at the edge. When Tier 2 Stops Mattering: The Moment a Plant Becomes Steady State in Corporate Memory Corporate memory is selective. The Board remembers the plants that have created problems, the sites requiring intervention, the operations that demanded investment. The Slovak plant has not. It has delivered forecast, shipped on time, and stayed within cost budget for seven quarters. It has become classified as steady state in corporate memory. Steady state is code for does not require our attention. The moment a plant earns this classification: When problems emerge, this slower cycle becomes a liability.
Why cross-border transformation starts with one verified fact base

In brief Transformation cannot be governed when headquarters and the local operation are working from different definitions, assumptions and figures. Before targets are set or initiatives launched, the first leadership task is to establish one verified view of the business: what cash is really available, what the order book actually commits to, what quality and capacity genuinely allow. Everything downstream, including the credibility of the plan itself, rests on that agreement. Where the fact base is contested, decisions stall or get taken twice. Why Subsidiaries and Headquarters Diverge: Operational vs. Financial Reporting No one sets out to run two versions of a business. It happens because a group needs comparability and a plant needs to run. Group finance defines revenue on a consolidated basis, recognises it under group policy, and reports monthly on a calendar the whole portfolio shares. The local operation measures what it can see and act on: what shipped, what the customer accepted, what is sitting in the yard waiting for a part. Both are accurate within their own frame. Neither is complete. Given eighteen months, the two frames drift far enough apart that a single word stops being reliable. “Backlog” means confirmed orders in one place and everything in the pipeline in another. “On-time delivery” is measured against the original promise at group and against the last revised promise locally. The gap is not concealment. It is the definition. Addressing Reporting Discrepancies: Why Boards Hesitate to Challenge Numbers This is where boards hesitate, and the hesitation is worth naming. Challenging the numbers feels like challenging the people. A group CEO who reopens the fact base is making an implicit statement about the managing director they appointed, the finance director who signs the pack, and their own judgement in accepting both for the last six quarters. There is also the quieter problem: if the definitions were wrong, then the decisions built on them were taken on the wrong basis, and some of those decisions were the board’s. So the fact base stays unexamined for longer than it should, while the operational explanation gets rehearsed instead. It was a timing difference. It was one bad month. The customer moved the schedule. Meanwhile the local team is usually working under constraints it has not been asked about directly. Group expectations set at portfolio level may not reflect what the site can produce with the tooling, headcount and supplier terms it has. Escalating that costs something politically. Absorbing it quietly costs less, until it cannot be absorbed. Two people keeping the household accounts in separate notebooks will both be honest and will never agree, and the argument when it comes will be about the money rather than the notebooks. The Complexity of Governing Cross-Border Industrial Operations Distance changes the mechanics, not just the mood. Information reaches headquarters aggregated and late, having passed through a local ledger, a statutory framework and a consolidation layer, each of which is legitimate and each of which removes detail. A group CFO in Munich reading a Hungarian subsidiary’s pack is reading an interpretation of an interpretation, and the operational facts that would explain the variance sit two translations away. The exposure is not marginal. Across the EU, foreign-controlled enterprises make up around 1% of market producer businesses but generate roughly a quarter of total value added, and in several Central European economies the concentration is far higher. Foreign-controlled enterprises accounted for 50% of value added in Slovakia, and 28% of jobs in both Slovakia and Czechia in 2023. A great deal of European industrial output is governed from a country other than the one it is produced in. Add statutory reporting that differs from group policy, ERP instances that were localised at implementation and never reconciled, and a management layer translating between two accounting logics every month, and the divergence becomes structural. It is not a language problem or a cultural one. It is a question of which numbers carry authority, who is permitted to change a definition, and how long it takes for an operational fact to reach the person accountable for it. Identifying the Signs of a Compromised Fact Base in Governance Not approaching this situation. Already in it. The last one is the reliable signal. Once decisions start waiting for agreement about the facts, the fact base has become the constraint on the business. Six Critical Metrics for Verifying a Single Business Truth Six areas carry almost all of the risk. Each needs a single agreed definition, an owner, and a documented source system. This exercise is unglamorous and it is where the value is decided. McKinsey’s research across 15 years of transformations found that completing a comprehensive, fact-based assessment of the business is one of three actions most predictive of a transformation capturing its full value, and that nearly a quarter of all value loss occurs during target setting, before implementation begins. Targets set on a contested fact base are compromised on the day they are agreed. The scale of ordinary error is easy to underestimate. In a Harvard Business Review study in which 75 executives assessed 100 of their own department’s records, 47% of newly created records contained at least one critical error, and only 3% of the resulting data quality scores were acceptable even on the loosest standard. The sample is small and self-assessed, and the study is now some years old, but the direction is consistent with what turns up whenever a group looks properly. Implementing a Fact-Based Decision-Making Framework Verification is not an audit. An audit establishes what happened. This establishes what is true now, so that a decision can be taken this week. The sequence that works is short. Agree the definitions in writing. Name one owner per figure. Fix the source system for each, so the same number cannot be produced two ways. Restate the last two quarters on the new basis, which is uncomfortable and necessary, because a new baseline without history gives the board nothing to judge movement against. Then set targets.
Local or International Interim Executive: Which Does the Transformation Require?

Choosing between a local and international interim executive is not a nationality decision. Learn how Boards should evaluate independence, statutory standing, shopfloor credibility, governance alignment, and turnaround authority before making the appointment.
Why a permanent plant manager search is too slow during a live turnaround

During a manufacturing crisis, waiting months for a permanent plant manager can accelerate cash loss, customer disruption, and operational decline. Learn why deploying an interim plant manager first stabilises the operation, reduces hiring risk, and creates the conditions for a successful permanent appointment.
The Private Equity Value Creation Plan Has an Operator Gap

The board pack shows pricing actions, procurement savings, headcount measures, working capital targets and a revised plant footprint. The private equity value creation plan assigns a financial benefit to each initiative, but teams still miss production schedules, inventory continues to rise and customers continue to delay decisions. The problem is not a shortage of analysis. The portfolio company lacks enough operating authority to convert the plan into changed behaviour, changed output and cash. Bain & Company reported in June 2026 that private equity firms held approximately 33,000 unsold portfolio companies, alongside an implied capital cycle and holding period of about seven years. The same report recorded four consecutive years of record-low distributions as a percentage of net asset value through the first half of 2026. A longer hold extends the period during which unfinished operational work consumes cash and management attention. The private equity value creation plan fails when ownership is separated from authority Capital pressure increases the operator gap in PE value creation Invest Europe reported that European private equity and venture capital firms raised €147 billion in 2025 and invested €135 billion. European divestments totalled €45 billion at historical investment cost in 2025, compared with €47 billion in 2024. Fundraising and investment recovered more strongly than realised disposals, leaving sponsors with more assets that must be improved, held or prepared for sale. The operator gap appears in three places Governance volume is a poor proxy for control. More steering meetings can improve visibility while leaving the underlying decision rights unchanged. The operating partner can challenge assumptions and impose milestones, but the company still needs an executive who can direct people, commit expenditure, stop work and accept the operational consequences. The portfolio-company CEO must sequence first 100 days value creation First 100 days value creation begins with subtraction A portfolio-company CEO usually receives more objectives than the organisation can execute at once. Pricing, footprint, procurement, management replacement and working capital reduction often compete for the same finance, engineering and plant resources. First 100 days value creation depends on deciding which constraint must move first and which initiatives must wait. Physical dependencies determine the order A plant cannot reduce labour, install equipment, qualify a new supplier and increase output simultaneously without creating delivery or quality risk. A commercial team cannot change price architecture while account managers remain measured only on volume. The CEO must choose the primary constraint and make the trade-off explicit. CE Interim has examined how post-acquisition CFO gaps destabilise reporting cadence, cash visibility and management alignment during the first 100 days. That finance gap is rarely isolated. It slows decisions across the entire programme. The CFO must prove that EBITDA margin improvement becomes cash EBITDA margin improvement reaches the report before it reaches cash Management can report EBITDA margin improvement before the company receives any cash benefit. Management may recognise procurement savings while old inventory remains on the balance sheet. Overtime, severance or lower output may offset labour reductions. Price increases may improve the income statement while receivables age and customer volumes fall. The CFO must separate the completed financial state from the cash that implementation consumes. Four financial tests support portfolio company operational improvement Measure the recurring profit effect after the company completes implementation. Record the one-time cash cost required to reach that state. Track the working capital effect during the transition. Set the date when the benefit appears in cash and financing headroom. Weekly evidence must connect finance to operations Institutional Limited Partners Association reporting standards shape how fund performance is communicated to investors, but company-level control still depends on weekly operating evidence. The CFO needs a bridge from the investment case to price, volume, mix, labour, material, overhead, inventory and receivables. Monthly EBITDA alone cannot show which physical driver is failing. The COO must convert portfolio company operational improvement into plant decisions Margin targets do not identify the physical constraint A manufacturing plan may assign one value to lower conversion cost, although the underlying causes can include unstable equipment, poor line balance, excessive product complexity, low yield, weak maintenance or an unsuitable footprint. Portfolio company operational improvement starts by identifying which condition limits throughput or absorbs cash. A general productivity programme cannot compensate for the wrong diagnosis. The sequence changes the financial result Reducing headcount before stabilising machine availability can increase overtime and missed deliveries. Renegotiating suppliers before simplifying specifications can preserve avoidable complexity. Closing capacity before transferring process knowledge can move disruption from one site to another. Regulatory work competes for the same management capacity European Commission moved the Carbon Border Adjustment Mechanism into its definitive regime on 1 January 2026, with authorisation, emissions reporting and certificate obligations for importers in covered sectors. The NIS2 Directive, Corporate Sustainability Reporting Directive and Corporate Sustainability Due Diligence Directive create further demands on data, controls and management capacity, even where scope and implementation differ by company. The CHRO must close the PE talent gap before execution capacity fails Experience and capacity are separate tests The PE talent gap is not limited to an unfilled role. It exists when competent leaders have never managed a restructuring, plant closure, integration or cash crisis under a compressed ownership timetable. It also exists when they have relevant experience but no capacity to execute change while keeping the base business stable. External appointments are common, but authority still decides the result Altrata BoardEx reported that external appointments accounted for approximately 70% of current US portfolio-company leadership-team members. Its dataset covered almost 12,000 companies and 55,000 individuals across the United States, Canada, the United Kingdom, Germany and France. It also found that 70% of portfolio-company CEOs had previously served as CEO elsewhere and 93% of CFOs had prior CFO experience. The CHRO must test whether the executive controls the teams and decisions that determine the result. A senior appointment placed inside the old reporting structure can preserve the same delay under a different name. The same test applies below the executive committee, where plant management, controlling, procurement and commercial leadership may
 EN
EN  DE
DE  FR
FR  IT
IT  PL
PL  RO
RO  CS
CS  SK
SK  HU
HU  ES
ES  RU
RU  AR
AR  SL
SL